RPU
Analytics(分析)RPU页面提供了选定时间范围内活动用户的RPU,总收入,和总活跃用户,图像可以基于每一天展示收入数据。
1.入口
- 登录
- 选择所需的帐户和应用程序。
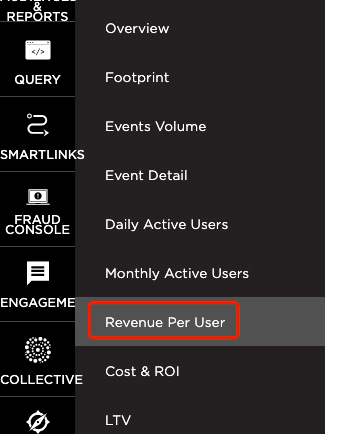
- SelectAnalytics >Revenue Per User.
2.分析页面工具
对于适用于本页面分析的工具,如日期字段,出口设备ID,共享页面和应用同类群组和过滤器的详细信息,请参阅我们的分析页面工具支持文档。
3.Revenue Per User Chart Overview
Active User totals are accounted for on the vertical axis and is represented by the blue bars.
Total User totals are accounted for on the vertical axis and is represented by the green bars.
Revenue Per User is accounted for on the vertical axis and is represented by the orange line.
NOTE:When leveraging Cross App functionality, RPU data for all apps within the App Name filter will be displayed. For more information about adding apps using the filter feature, refer to ourAnalytics Page Toolssupport documentation.
 A. Data being displayed. Click to activate/deactivate
B. Total Revenue vertical axis
C. Active Users vertical axis
D. Revenue Per User vertical axis
E. Time frame horizontal axis
Mousing over the Revenue Per User chart will display the data for the corresponding day. Each metric will be displayed in a color coordinated box over the selected day.
 A.鼠标悬停日期显示数据
4.缩小特定日期范围
缩小日期范围:
针对特定时间范围中的数据可以更详细地看到。
- 点击并按住开始日期。
- 拖动到结束的日期和版本。
 A.点击,按住并拖动日期范围
现在显示选定的日期范围。对于精日期范围内每一天的具体数据可以将鼠标移至日期进行查看。
注意:日期范围可以精炼到两天。
回到全图显示:
In order to return to the full graph, Click“-“.
 A.鼠标悬停查看日期的具体数据
B.点击返回原来的日期范围
5.下载日活跃用户数据
每日活跃用户图表中显示的数据可以采用多种不同格式下载。
图形下载:
选择下载按钮>图像:
- PNG
- JPG
- SVG
下载图表数据:
选择下载按钮>数据:
- CSV
打印数据:
选择下载按钮>打印。